


In the absence of government data …
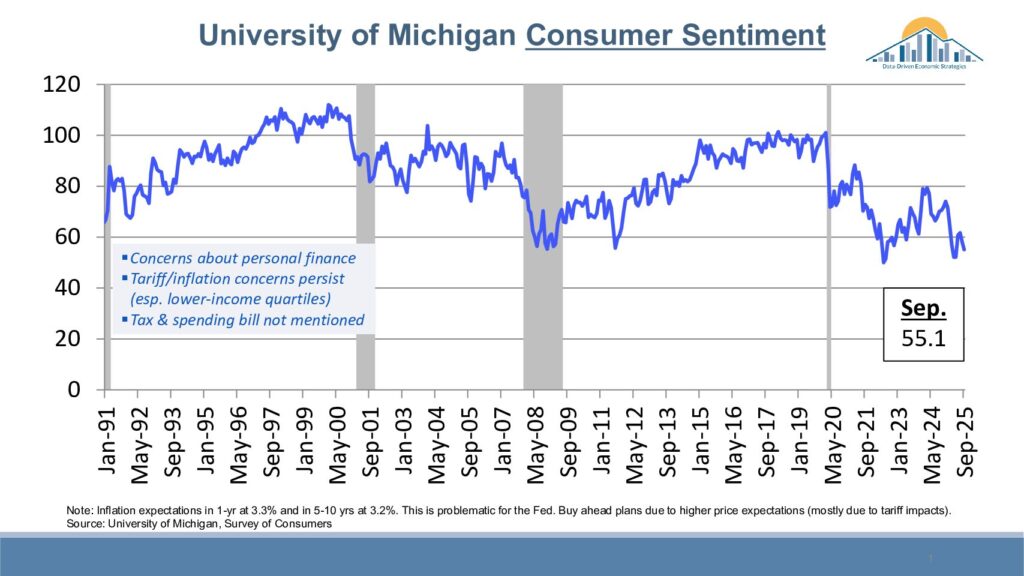
I have been fascinated by the continued rallies in the stock market as juxtaposed to consumer surveys, which show caution and pessimism about the U.S. economy.
Key indicators are telling us conflicting things.
Let’s start with consumer spending, which appears robust despite souring consumer confidence. A recent study by Mark Zandi, Moody’s chief economist, showed that currently the top 10% of American consumers comprise fully 50% of all consumer spending. By historical standards, this is very high. Remember, two-thirds of GDP is consumer spending, so by extension one-tenth of our population is driving the lion’s share of our economic growth.
The question then becomes, what about the other 90% or even bottom half in terms of household income and spending? Especially right now with the government shutdown and the halting of economic data, I wanted to share some nongovernmental statistics that give us a clue.
Sales of very cheap food items such as canned tuna, rice, beans and macaroni are up this year. Hamburger Helper sales have increased 15% through August, according to Eagle Foods, and Yelp searches for cheap eats are up 21%. These are meaningful indicators of the spending patterns of middle- and lower-income households.
Given that food at home has increased roughly 26% since early 2020, and wage growth is now slower, these spending trends aren’t surprising.
Similarly, Google searches for help with mortgages have surpassed levels last seen since the Great Recession. One-third of adults in the past year say they’ve opted out of getting the health care they need due to financial constraints. That’s up from 9% of adults forgoing care in 2023, according to Prof G Markets. Even for people with health insurance, deductibles in the thousands and hefty copay percentages can be barriers to getting the care we need.
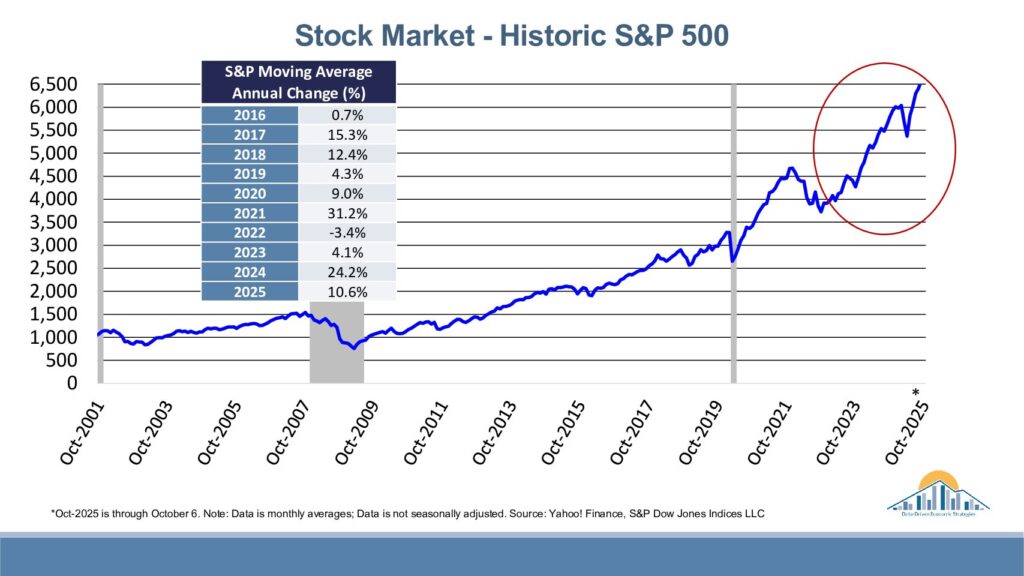
Yet, the stock market rallies on with almost logarithmic increases over the past couple of years. There is talk of a bubble that may pop given that roughly 55% of the S&P 500 gains since 2021 come from only 10 mega, primarily tech companies. Over the past year, those estimates ranged 50% to 70% of total stock market gains from those top 10 companies. This means the other 490 companies in the S&P performed at fractional levels.
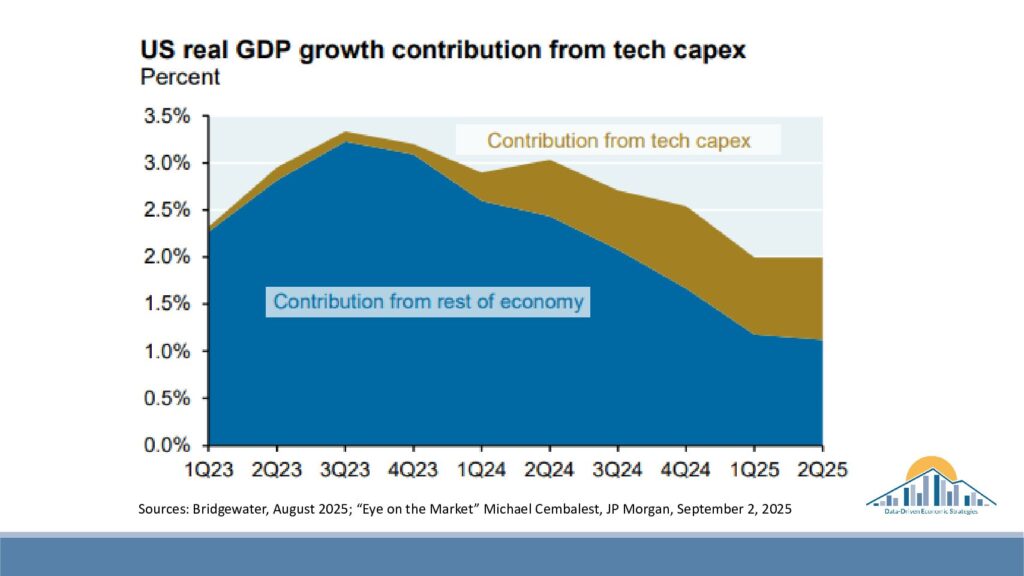
Many finance and economic experts state that the artificial intelligence boom is a large portion of the growth in the nation’s GDP, also creating the illusion of outsized economic growth and resilience.
So, we know the average American is cutting back and feels cautious, but if the stock market has a major correction, that top 10% who buys 50% of all goods and services in the U.S. also could cut back. And combined, this could create an economic compression from the top and bottom.
Next week, I’ll focus on why there is talk of an AI bubble.
Tatiana Bailey is executive director of the nonprofit Data-Driven Economic Strategies. Other Gazette articles, TV segments, DDES monthly economic dashboards with technical explanations, and how to sponsor their work can be found at ddestrategies.org.
IF YOU GO
A year-end economic and legislative update is scheduled Nov. 5 from 2 to 4 p.m. (with networking to follow) at Garden of the Gods Resort & Club.
Colorado state Budget Director Mark Ferrandino will provide a state legislative and budget update, and Tatiana Bailey will provide an update and forecast for the economy.
Real estate CE credits are available for the event.
General Admission for the event will be $65 plus fees. For details and registration, go to www.ddestrategies.org.