


Tatiana Bailey: That pesky inflation still at play, delaying rate cuts
Last week, I did a presentation for yet another rate-dependent industry, and it’s striking to me how those brokers and investors are waiting with bated breath for that first rate cut from the Fed.
The room is particularly quiet when I talk about inflation. January’s headline inflation rose 3.1% from January a year before, but “core” inflation stayed the same at 3.9%. As I stated in a recent inflation segment, 3.1% is a whole lot better than the almost 9% we had in 2022, but today’s increases are on top of the 25% to 35% increases over the pandemic period. The most recent data releases also show we have been stuck around that 3% mark.
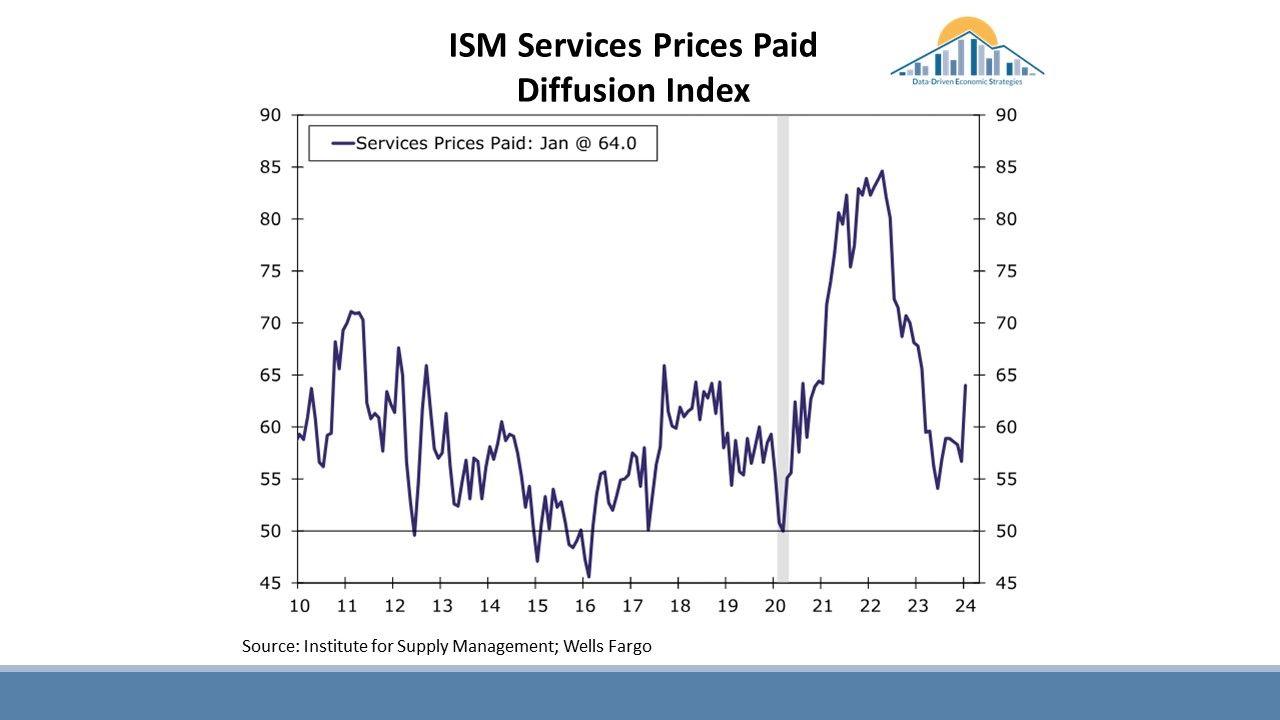
To give me some clues about where prices (and interest rates) are headed, I am closely watching producer surveys. The manufacturer’s ISM survey showed a nine-month high in the prices paid component at 52.9 in January, up from 45.2 in December (anything above 50 implies upward pressure). If it’s costing producers more to make a widget or deliver a service, those costs will be passed onto us. Manufacturers state that shipping costs are higher. More specifically, the services subcomponent of the ISM had a huge upside surprise in prices paid and wages are a big part of that.
Likewise, the small business National Federation of Independent Business survey showed 33% of businesses are expecting to raise prices in the next three months, citing inflation as their overall biggest concern. That 33% is four points above January of last year. I anecdotally have been talking to some small, local business owners who feel frustrated at the persistence of the prices they pay alongside the weakened demand. Many of them say that during the pandemic they were able to pass on price increases and consumers would pay (with stimulus money or accumulated savings), but that is no longer the case.
The labor market is another inflation-related indicator because of wage pressures. In January we had an upside surprise to employment (+353,000) alongside a 0.6% increase in average hourly earnings, which was double the expected increase. Gains were broad-based across many industries. We aren’t gaining any new workers as labor participation is still below pre-pandemic levels, and well below that of peer nations. Likewise, unemployment rates did not move materially.
All in all, March rate cuts are looking very unlikely, and if I were a betting woman, I would say that the coveted first rate hike will happen in June, with two more cuts after that before year end.
On the flip side, there is a strong anti-inflationary pressure at play that can have real impact. Productivity data can be volatile, but I think it’s now safe to say that the overall trend has been strong. Output per hour worked increased at a 3.2% annualized rate in the fourth quarter of 2023 (or year-over-year up 2.7%). The “usual” or historical gains in productivity have been closer to 1.5%. As productivity increases while inflation rates slow down, employers have greater output without having to increase hours, number of workers or prices. Largely because of these productivity gains, per-unit labor cost increases are now very close to the Fed’s preferred 2.0% target. In other words, the awesome, average U.S. worker is chipping away at inflation through hard work and probably greater use of automation, AI and other efficiency tools. High job satisfaction is also likely helping. If this trend of strong productivity continues, it could help mitigate the wage-inflationary pressures of fewer working-age people. I am not an AI or robotics expert, but when I get asked about the workforce implications, I can’t help but think that the timing of these technological advances may be fortuitous given it may enable more output with fewer people.
For the remainder of this monthly narrative, I’d like to focus on some local statistics. First, the Massachusetts Institute for Technology living wages for 2023-’24 were released and, as expected, the wage necessary to meet basic expenses in our region increased materially. For example, the annual living wage for a household with one adult and two children went from $102,253 last year to $116,584 this year (+14%). For a household with two working adults and two children, the living wage went from $55,619 last year to $63,211 per working adult this year (+14%). The living wage for a single person did not change as much (+6%) and now stands at $29,994. Of course, inflation in general has a lot to do with those marked increases for families, but so does the shrinking supply of child care alongside the high costs of child care overall. This is likely why living wages for family incomes increased at more than double the rate of single workers.
We’ve also decided to squeeze in another important graph on the demographics page of the monthly economic dashboard (online at ddestrategies.org). We now have El Paso County high school graduation rates and earnings by district. This data helps inform our workforce development initiatives in partnership with schools and nonprofits, and I have to say the statistics are striking. You can get the full story in a previous Gazette article. But in a nutshell, the highest graduation rates at roughly 95% or above are almost double the lowest graduating district. It’s important to include the qualifiers that Edison and Calhan, the two highest-graduating districts, have fewer than 100 high school students. Cheyenne Mountain (350) and Lewis Palmer (600) are both significantly larger. The lowest-graduating district, District 49, at a 56% graduation rate, had many students in online schooling, which markedly pulled down the districtwide average. Excluding the largest online school, District 49 had a 88% graduation rate in 2022.
Median earnings for full-time work by district have been calculated. The lowest-earning district, Harrison, had median earnings in 2022 of $41,496 whereas the highest-earning district, Lewis Palmer, had median earnings of $86,928 (more than double). Harrison had the lowest median earnings, but an 80% graduation rate, slightly below the state average (82%). The Gazette article dedicated to this topic has more info on the proportion of kids eligible for free and reduced lunch, the income levels to qualify for fully free lunch for a family of four, and how that compares to the living wage. This all made me think of my public health days and how there are parallels between health and education. The overall (subpar) U.S. outcomes in both health and education are in large part due to the markedly lower outcomes for low-income populations. In both realms, if we can enact solutions that target the lower-income populations, the U.S. catapults to the top 10% of peer nations instead of 47th (life expectancy, U.N. data) or 18th (education outcomes, Organization for Economic Cooperation and Development).
Returning to the theme of inflation and the timing of interest rate cuts, I’d like to point out the local information on cost of living in the monthly economic reports. As I’ve mentioned in previous monthly summaries, Colorado Springs MSA had a 2023 cost of living index of 107.9%, meaning our region was about 8% more expensive than the average U.S. city last year. We all know that sharp increases in housing costs are largely to blame. I got gasps at last week’s presentation when I stated that from January 2020 to January 2024, new and existing home prices have increased 59.1% (the analogous U.S. increase is ~40%). Not surprisingly, the 2023 Q4 Housing Opportunity Index, or HOI, inched down even further to 21.1% (versus 21.5% in 2023 Q3). This index tells us that 21.1% of the homes sold in our region are affordable to the median household income.
I get a lot of questions about this unfortunate statistic and how to reconcile it to the lower, regional average annual wages. The past qualifier that our wages are lower because our cost of living is lower no longer holds true. The chasm is now big enough that we need both wages to increase and housing costs to decrease to get to some semblance of equilibrium.
The housing affordability challenge is not ours alone. The National Association of Realtors Housing Affordability Composite Index for the U.S. dropped below 100 in the second quarter of 2023 and has been sub-100 since. This indicates that a family in the U.S. with a median income does not have the funds to purchase a median-priced existing single-family home using conventional financing. Which brings us full circle to those coveted rate hikes and how pivotal they can be. During this cycle, homebuying has ticked up markedly when there are even small incremental declines in interest rates. That tells me that as soon as the Fed commences cuts, there will be heavy real estate activity. Existing homeowners who have been wanting to move will move. New first-time homeowners with the requisite down payment will finally buy. Pent-up demand will kick in, and that is also true for investments of other types. I am hoping this prompts more residential (particularly single-family) construction across price ranges so our young families plant roots (including my own brood).
Tatiana Bailey is the executive director of the nonprofit Data-Driven Economic Strategies. To see this report with a full dashboard of graphics, go to www.ddestrategies.org. To learn how to support the group’s work, email rwilder@ddestrategies.org or gglassford@ddestrategies.org.
Tatiana Bailey